
Understanding Impermanent Loss Over Time on Uniswap v3 (Pre-Sages Lab 🧪)
Team 4

Contributors: Caleb | Chisom | Freeman
Mentor: Brandyn
Introduction:
Decentralized finance (DeFi) has revolutionized how liquidity is provided to markets, with Uniswap standing as a cornerstone of this transformation. Uniswap v3 introduced a groundbreaking feature—concentrated liquidity—allowing liquidity providers (LPs) to allocate capital within custom price ranges rather than across an entire price curve. This innovation promises higher capital efficiency and increased fee earnings, particularly for stable or predictable pairs like USDC/ETH, but it also amplifies a persistent challenge in automated market makers (AMMs): impermanent loss (IL). Unlike traditional holding strategies, where asset value tracks market prices directly, IL emerges when the price of pooled assets diverges from their initial deposit ratio, potentially leaving LPs with less value than if they had simply held their tokens. Over time, this loss can evolve, influenced by price volatility, fee accumulation, and the strategic choices LPs make, such as the tick range they select for their liquidity.
Understanding IL over time is critical for LPs navigating Uniswap v3, as it shapes the risk-reward calculus of providing liquidity. While earlier Uniswap versions spread liquidity uniformly, v3’s concentrated approach ties IL tightly to an LP’s price range. The USDC/ETH pool, pairing a stablecoin (USDC) with a volatile asset (Ethereum, ETH), offers a compelling case study. Its dynamics reflect both the stability of pegged assets and the unpredictability of Ethereum’s price swings, making it a reflection of DeFi’s opportunities and pitfalls. Moreover, the interplay of trading fees—earned when prices remain within an LP’s tick range—might offset IL, turning time into a pivotal variable: the longer a position is held, the more fees might mitigate losses, yet the greater the exposure to price divergence.
This analysis dives into IL’s temporal evolution on Uniswap v3, leveraging granular data from Flipside Crypto to track a specific user’s liquidity position in the USDC/ETH pool. By focusing on their chosen tick range and initial deposit, we can quantify IL as the difference between the pool’s value and a hypothetical “HODL” strategy over a defined period, while accounting for fees accrued. This approach not only illuminates how IL unfolds day-to-day but also reveals how strategic decisions—like setting a tight or broad tick range—interact with market conditions to shape outcomes. As DeFi matures, such insights are vital for LPs seeking to optimize returns and for the broader ecosystem aiming to refine AMM design. Through this lens, we explore a fundamental question:. How does impermanent loss behave over time in Uniswap v3?
OBJECTIVE OF THE RESEARCH
Define Impermanent Loss in the Context of Uniswap v3 : Provide a clear definition of impermanent loss specific to Uniswap v3, accounting for concentrated liquidity and dynamic fee tiers.Why: Uniswap v3's unique features require a tailored definition of impermanent loss that differs from traditional AMMs like Uniswap v2.
Quantify Impermanent Loss Over Different Time Horizons:Measure how impermanent loss evolves over short-term, medium-term, and long-term periods. Impermanent loss is not static and can change significantly as asset prices fluctuate over time.
Analyze the Impact of Concentrated Liquidity on Impermanent Loss:Study how the concentration of liquidity within specific price ranges affects impermanent loss over time. Concentrated liquidity can amplify impermanent loss if the price moves out of the specified range, but it can also reduce loss if the price remains within the range.
Evaluate the Role of Fee Income in Offsetting Impermanent Loss: Assess how fee income earned by LPs can offset impermanent loss over time. Fee income is a critical component of LP returns, and understanding its relationship with impermanent loss is essential for assessing net profitability.
Compare Impermanent Loss Across Different Trading Pairs: Compare impermanent loss over time across various asset pairs (e.g., stablecoin pairs, volatile pairs). Different pairs exhibit varying levels of volatility and trading volume, which directly impact the magnitude and evolution of impermanent loss.
Analyze the Impact of Market Volatility on Impermanent Loss : Study how market volatility affects the magnitude and duration of impermanent loss. High volatility can lead to larger and more frequent price swings, increasing the risk of impermanent loss.
Methodology:
This study analyzes impermanent loss in the USDC/ETH pool on Uniswap v3, using a specific user's liquidity position as a reference point. Data is sourced from Flipside Crypto, extracting liquidity positions, swaps, and price movements within the selected pool. The analysis follows a step-by-step approach, beginning with identifying the user's liquidity range and initial deposit values. The historical price and fee data within the position's active range are retrieved to track changes over time. Full Analysis can be found here Here
Impermanent loss is calculated by comparing the value of the user's liquidity position at different price points against a hypothetical scenario where the assets were held without providing liquidity. The study incorporates swap data to assess how liquidity shifts impact the user's holdings, factoring in collected fees to determine net profitability. To enhance accuracy, the analysis accounts for liquidity concentration effects, adjusting for tick spacing and price impact on returns. Finally, a time-series approach is applied to observe impermanent loss trends, correlating them with major market price of USDC and ETH
Impermanent Loss in Uniswap v3
Uniswap, one of the pioneering decentralized exchanges (DEXs) built on Ethereum, operates as an Automated Market Maker (AMM). AMMs replace traditional order books with liquidity pools, where liquidity providers (LPs) deposit pairs of tokens to facilitate trading. Before Uniswap V3, liquidity in these pools was distributed uniformly across the entire price range (from 0 to infinity). This meant that, regardless of the current trading price, liquidity was spread thinly, leading to capital inefficiency. For example, in a pool of ETH and USDT, liquidity was available even at extreme price ranges (e.g., ETH at $0.01 or $1,000,000), where trading activity was unlikely to occur. This inefficiency often resulted in lower returns for LPs and higher slippage for traders.
The introduction of Uniswap v3 in May 2021 marked a significant evolution with the concept of concentrated liquidity. Unlike its predecessors (V1 and V2), Uniswap v3 allows LPs to specify custom price ranges for their liquidity. For instance, an LP might concentrate their ETH/USDT liquidity between $2,000 and $3,000, ensuring that their capital is only active within that range. Outside this range, their liquidity becomes "inactive" and does not participate in trades. This innovation enhances capital efficiency dramatically—LPs can earn higher fees by focusing their funds where trading volume is highest. However, this concentrated liquidity also introduces new dynamics to an old challenge in AMMs: impermanent loss (IL).
Understanding Impermanent Loss
Impermanent loss refers to the difference in value between holding assets in an AMM liquidity pool and simply holding (or "HODLing") those assets outside the pool. It arises due to price divergence between the pooled assets and is "impermanent" because the loss only materializes if the LP withdraws their funds at a suboptimal time. If the prices revert to their initial ratio, the loss disappears—hence the term.
In a typical AMM like Uniswap, liquidity pools maintain a constant product formula:
m n = k
where:
m and n represent the quantities of the two tokens in the pool (e.g., ETH and USDC),
k is a constant that ensures the pool’s balance.
When the external market price of one token (e.g., ETH) rises or falls relative to the other (e.g., USDT), arbitrageurs step in. They trade against the pool to align its price with the global market, adjusting the quantities of m and n while keeping k constant. This rebalancing process is the root cause of impermanent loss.
For example, suppose an LP deposits 1 ETH and 2,000 USDT into a pool when 1 ETH = 2,000 USDT (total value = $4,000). If ETH’s price rises to 3,000 USDT, arbitrageurs will buy ETH from the pool and sell USDT into it until the pool’s price matches the market. The LP’s holdings might adjust to, say, 0.816 ETH and 2,449 USDT (still worth $4,897 in total due to fees and rebalancing). If the LP had HODLed instead, their 1 ETH and 2,000 USDT would now be worth $5,000. The difference—$103—is the impermanent loss.
Impermanent Loss in Concentrated Liquidity (Uniswap v3)
Uniswap v3’s concentrated liquidity amplifies both the rewards and risks of providing liquidity. Since LPs can allocate their capital to specific price ranges, they earn fees proportional to the trading volume within that range, rather than across the entire curve. This can lead to significantly higher returns when the price stays within the chosen range. However, it also magnifies impermanent loss when the price moves outside that range.
Consider the research excerpt from topaz.blue:
"An AMM always sells the outperforming asset and buys the underperforming asset. It is easy to see that this leads to a loss against HODL: the initial pool contribution was equal in value. Then the pool keeps selling the outperforming asset as it goes up. In other words, during a rally, instead of HODLing, the pool sells the outperforming asset into the rally, meaning it can no longer profit from subsequent price increases. That, in a nutshell, is the source of IL." ( Topaz Blue & Bancor Protocol. (2021, November 17). Impermanent loss in Uniswap V3. Topaz Blue. https://topaz.blue/uniswap-v3-report )
This succinctly captures the mechanics of IL. In Uniswap V3, if an LP concentrates liquidity between ETH prices of $2,000 and $2,500, and ETH surges to $3,000, their liquidity becomes inactive (out of range). At that point, their position is fully converted into the underperforming asset (e.g., USDT), locking in the IL unless the price returns to the range. In contrast, a v2 LP would still have some ETH exposure, albeit diluted across the full price spectrum, resulting in a less severe but still present IL.
In Uniswap v3, the calculation is more complex due to concentrated liquidity. IL depends on the price range chosen by the LP. If the price moves outside the range, the LP’s position becomes 100% of one asset, and IL can be calculated as:
IL = (V_{pool} - V_{HODL})V_{HODL}
where:
V_{pool} is the value of the LP’s position after price movement,
V_{HODL} is the value of the original assets if held
OBJECTIVES:
1: Quantifying Impermanent Loss Over Different Time Horizons
The impact of impermanent loss is not static; it evolves as asset prices fluctuate over time. The time horizon—short-term, medium-term, or long-term—plays a significant role in determining the magnitude and significance of impermanent loss.
1. Short-Term Impermanent Loss
In the short term, impermanent loss is highly sensitive to price volatility. During this period, asset prices can experience sharp fluctuations due to market news, speculation, or sudden changes in supply and demand.
Characteristics:
High volatility leads to rapid changes in the price ratio of assets in the pool.
Impermanent loss can spike quickly but may also reverse just as fast if prices stabilize.
LPs are exposed to significant uncertainty, as the direction and magnitude of price movements are unpredictable.
Suppose an LP deposits ETH and USDT in a 50:50 ratio. If the price of ETH increases by 20% within a day due to a market rally, the LP will experience impermanent loss as arbitrageurs trade against the pool to rebalance the prices. LPs can focus on stablecoin pairs or assets with lower volatility to minimize short-term impermanent loss. Providing liquidity in pools with high trading fees can offset some of the losses.
2. Medium-Term Impermanent Loss
Over a medium-term horizon (weeks to months), impermanent loss tends to stabilize somewhat, as short-term price fluctuations average out. However, the cumulative effect of price changes can still be significant.
Characteristics:
Price trends become more apparent, and the likelihood of prices returning to their original ratio decreases.
Impermanent loss becomes more "sticky," meaning it is less likely to reverse fully.
LPs must weigh the potential for impermanent loss against the fees earned from trading activity.
If ETH experiences a sustained price increase of 50% over three months, the impermanent loss will compound, and the LP's position will increasingly favor the less valuable asset (USDT in this case). Diversifying across multiple pools can reduce exposure to a single asset's price movements. LPs can monitor price trends and adjust their positions accordingly.
3. Long-Term Impermanent Loss
In the long term, impermanent loss is heavily influenced by the overall market trajectory and the divergence of asset prices. Over extended periods, the likelihood of prices returning to their original ratio diminishes, making impermanent loss more permanent.
Characteristics:
Long-term price divergence leads to significant impermanent loss, as the assets in the pool may no longer have any meaningful relationship to their original prices.
The impact of impermanent loss may outweigh the fees earned, especially in low-fee pools.
LPs must consider the opportunity cost of holding assets in a pool versus holding them outright.
If ETH increases by 300% over a year while USDC remains stable, the LP's position will be heavily skewed toward USDC, resulting in substantial impermanent loss. LPs can choose pools with assets that are expected to maintain a stable price relationship over time (e.g., ETH and wBTC).Dynamic fee structures or concentrated liquidity models (e.g., Uniswap v3) can help mitigate long-term impermanent loss.
2: Analyzing the Impact of Concentrated Liquidity on Impermanent Loss
Finding I: Impermanent loss (IL) increases as the price tick moves towards the upper or lower tick range and becomes more when the price crosses the range.
In Uniswap v3, a user's liquidity remains active only within their specified tick range When the USDC/ETH price initially starts between the range and begins approaching the range boundaries, impermanent loss (IL) gradually increases due to shifts in the pool’s token composition. As the price nears the upper tick , the user holds a greater proportion of ETH and less USDC; conversely, as it approaches the lower tick, the user holds more USDC and less ETH. This causes deviation from the initial asset allocation leading to a divergence from the original portfolio value, where changes in ETH’s price directly affect the total holdings. The closer the price moves to the boundary of the tick range, the more pronounced this divergence becomes, resulting in a gradual increase in impermanent loss.
However, when the price moves beyond the specified range, impermanent loss (IL) increases significantly. This occurs because, outside the defined range, the user's liquidity ceases to be a balanced mix of USDC and ETH. Instead, above upper tick range , the entire position is converted to ETH , while below lower tick range, it consists entirely of USDC .
In contrast, the value of a simple holding (HODL) strategy accounts for price changes in both assets. This complete shift to a single asset amplifies losses compared to maintaining exposure to both assets, as it prevents the user from benefiting from the price movement of the excluded asset. Within the active range, IL increases gradually due to continuous rebalancing. However, once the price moves beyond the range, IL spikes because the liquidity position remains entirely in one asset while the market continues to fluctuate.
Finding II : When there are sharp decreases or increases in price, IL gets amplified even within the range specified.
Even when the ETH/USDC price stays within user’s tick range, a sharp price swing in a single day—amps up IL fast. Here’s why: within the range, Uniswap v3 still adjusts your USDC and ETH amounts based on the current price, following the concentrated liquidity formula. A sudden jump means the pool quickly shifts to more USDC and less ETH, because arbitrageurs buy ETH from you. The HODL value, though, leaps higher , and the pool value lags, so IL spikes becomes bigger with sharper moves.
Similarly, a sharp drop in price gives you more ETH and less USDC, amplifying IL again because the value of Eth has decreased. The faster the price moves, the more the pool’s rebalancing can’t keep up with the HODL value’s linear change, widening the gap. Concentrated liquidity makes this worse than v2 because your liquidity is packed into a narrow range, so even small, quick shifts within it hit your position harder—unlike v2’s spread-out buffer. Sharpness matters: a 5% jump in a day hurts more than a 5% drift over a week, as the pool’s adjustment lags the market.
3. Evaluating the Role of Fee Income in Offsetting Impermanent Loss
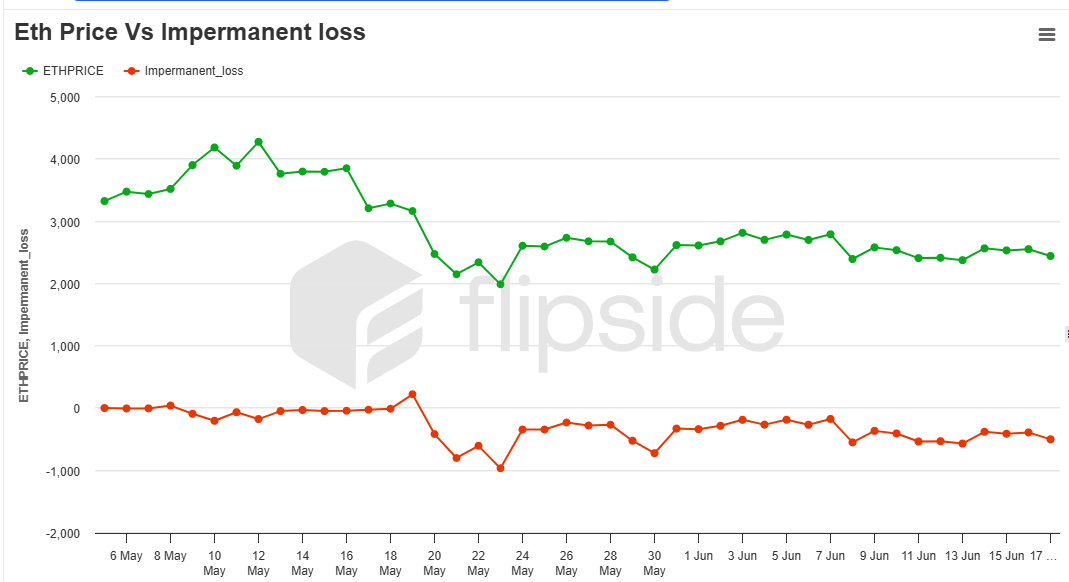
While fee income in Automated Market Makers (AMMs) is often cited as a partial offset to IL, the extent to which fees mitigate these losses remains a point of debate (especially in volatile market conditions). This section focuses on an ETH–USDC liquidity position by a Liquidity provider over a defined period (2021-05-05 to 2021-06-17), highlighting how collected fees can reduce but not always eliminate IL.
Data Source
Daily net position data was gathered from a single liquidity provider (LP) in the ETH–USDC pool. Visit the table for reference Here. The net position incorporates:
Pool Value: The combined value of ETH and USDC tokens held in the pool at the end of each day.
Accrued Fees: All trading fees generated during that day, which are automatically reinvested into the LP’s position.
Impermanent loss: The difference between asset value in pool and value if held outside the pool.
Data was sourced from Flipside Crypto, focusing on daily snapshots to capture both gradual and abrupt market movements.
Key Assumptions
Fees are not reinvested continuously.
No additional deposits or withdrawals occurred during the study period.
Results
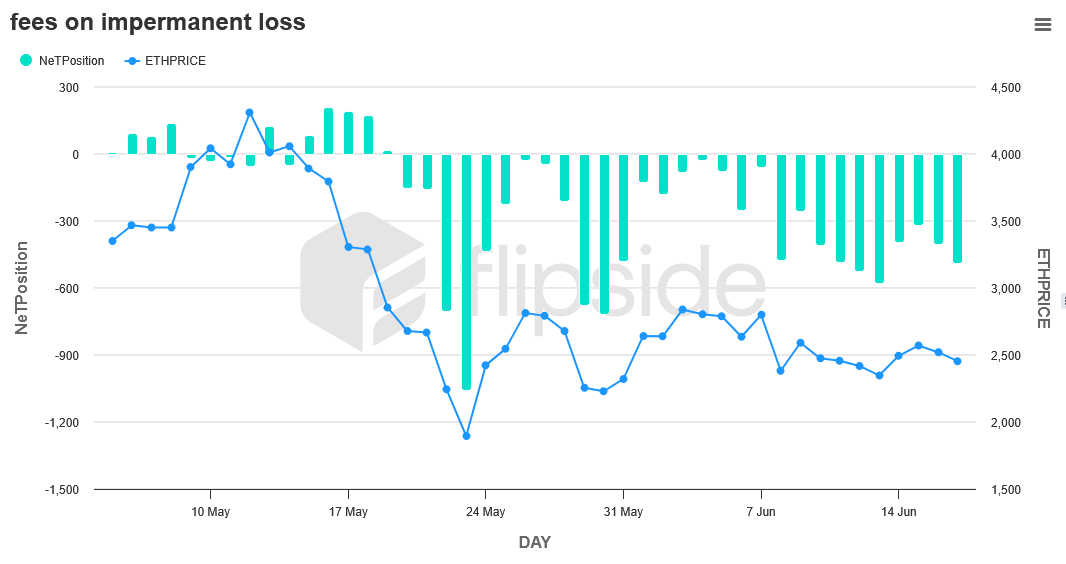
Frequent Negative Net Position
On most days, IL outweighed fee income, keeping the net position below zero. This indicates that while fees partially offset losses, they were insufficient to fully counteract the effects of price divergence between ETH and USDC.
Correlation with ETH Price Movements
Sharp declines in ETH price coincided with larger negative swings in the LP’s net position, reflecting higher IL.
Conversely, during moderate price movements, fees helped the LP’s position recover slightly, demonstrating that fees do offer partial mitigation under less volatile conditions.
Recovery Periods
There were intervals of partial recovery, where daily fees meaningfully narrowed the gap between the pool’s value and the HODL value. However, these rebounds did not typically return the net position to be positive unless possible if ETH’s price stabilized or reversed strongly.
Conclusion
In this ETH–USDC pool analysis, fee income provides a meaningful but incomplete buffer against impermanent loss. The degree of offset depends heavily on market volatility: in periods of extreme ETH price swings, IL grows faster than fees can compensate. These findings underscore the importance of understanding both market conditions and liquidity management strategies when providing liquidity. By closely monitoring price trends, adjusting ranges (if applicable), and recognizing the limits of fee income as a hedge, LPs can make more informed decisions that balance potential fee gains against the risk of impermanent loss.
4: Compare Impermanent Loss Across Different Trading Pairs
Uniswap v3 introduces concentrated liquidity, allowing liquidity providers (LPs) to allocate capital within custom price ranges. While this enhances fee generation and capital efficiency, it also alters the dynamics of impermanent loss (IL), particularly under volatile market conditions.
Data source
Historical IL data was collected over a two-month period from Uniswap v3 pools on flipside crypto database. Three primary categories were analyzed:
Stable-stable Pair: We looked at the the USDC/USDT pool, which both are somewhat stable with little to no price volatility.
Stable–Volatile Pairs: For example, the USDC/WETH pool, where USDC is pegged while WETH exhibits typical market volatility.
Volatile–Volatile Pairs: Including pools such as MATIC/WETH, LINK/WETH, and WBTC/WETH, where both assets demonstrate significant price swings.
Since we are looking at volatility, IL was calculated using the formula;
IL = 1-r1 + r
where r is the ratio of the final price to the initial price.
For small changes (e.g., in stablecoin pairs), r remains close to 1, resulting in minimal IL.
For larger deviations (common in volatile pairs), the non-linear nature of the square root function causes IL to increase disproportionately.
Results
The analysis revealed distinct differences between the pair types:
Stable-stable Pair: IL is near zero.
Volatile–Volatile Pairs:
Magnitude: IL reached higher negative percentages (with observed ranges often between –3% and –9%), reflecting the substantial price divergence when both assets experience high volatility.
Duration: Elevated IL levels persisted over longer periods when price divergences were sustained, particularly when prices frequently exited the LP’s active range.
Stable–Volatile Pairs:
Magnitude: IL was generally lower, commonly ranging from –0.1% to –3%, due to the stabilizing effect of the pegged asset (USDC). However, significant moves in WETH still resulted in noticeable IL spikes.
Dynamic Impact: When WETH’s price remained within the LP’s designated range, IL remained moderate. Sudden moves outside this range, however, resulted in rapid increases in IL.
These outcomes underscore the influence of market volatility and the critical role of liquidity positioning in Uniswap v3. Concentrated liquidity can both amplify fee revenues and exacerbate IL if prices move sharply relative to the chosen range.
Market volatility is the primary driver of impermanent loss in Uniswap v3. In volatile–volatile pools, both assets contribute to larger price deviations, thereby increasing IL non-linearly. For stable–volatile pairs, while the presence of a stablecoin mitigates overall price divergence, significant volatility in the non-stable asset can still trigger considerable IL.
Furthermore, the dynamics of concentrated liquidity mean that the selected price range is crucial. LPs who actively adjust their ranges in response to market conditions may reduce their IL exposure, whereas static ranges can lead to prolonged periods of higher IL if the market moves unexpectedly.
This analysis highlights a clear risk–reward trade-off: while high volatility can lead to increased fee income due to greater trading volumes, it also elevates the risk of impermanent loss. Consequently, LPs must carefully balance these factors—potentially by adopting dynamic liquidity management strategies—to optimize their positions in volatile markets.
5: Analyzing the Impact of Market Volatility on Impermanent Loss
IL Table Used: HERE
Market volatility significantly impacts impermanent loss (IL) in Uniswap v3. High volatility increases IL as asset prices move beyond the LP’s chosen range, leading to 100% exposure to one asset and loss of trading fees. In contrast, low volatility keeps liquidity active, reducing IL
Finding I: Bigger Price Changes Drive Bigger IL, Regardless of Direction
Data reveals that larger daily price changes consistently lead to higher IL, whether ETH rises or falls. A -1.84% price move (see table , row 12, $3801.15 ⇒ $3730 ) within the range yields modest IL ( AssetValueInPool ~ $6701, TotalHoldingValue $6776, IL = -$24.47), but a 18.844% price swing (see table , row 20, $2039.98 ⇒ $2424.39) pushes IL to -$493.277 (AssetValueInPool ~ $4926.6, TotalHoldingValue $5419.9) even in-range
.
Reason: Bigger swings widen the gap between the pool’s rebalanced value and HODL’s linear price scaling. Within the range, rapid shifts (e.g., 18% in a day) adjust the token mix (more WETH, less USDC ) faster than HODL reflects, amplifying IL. Direction doesn’t matter—magnitude does—because volatility stretches this divergence symmetrically, a hallmark of v3’s tight range concentration.
Finding II : IL Escalates Sharply When Volatility Crosses the Tick Range
The effect intensifies when price changes push beyond the range, with IL surging as swings grow. A -8.2% price swing past the upper tick range (see IL table, row 19) flips the position to consist of ( EthInPool ~ $4122.77, UsdcInPool ~ 0). This amplifies the impermanent loss to -$912.72 .
Reason: Crossing the range halts rebalancing , holding only ETH misses USDC’s stability; holding only USDC misses WETH’s movement. Bigger price changes (-8% ) increase the frequency and distance of these breaches, exponentially hiking IL as the single-asset position diverges further from HODL, a direct impact of concentrated liquidity’s range cutoff.
Recommendations for Liquidity Providers
Prioritize Stablecoin or Low-Volatility Pools
IL is most severe when asset prices diverge significantly. LPs should favor pools with stablecoin pairs (e.g., USDC/USDT) or assets with correlated price movements (e.g., ETH/stETH). Research shows these pools experience lower IL, making them safer options for passive income with less risk of net losses.
Widen Liquidity Ranges Strategically
Narrow ranges amplify IL when prices move outside them, leaving LPs with only one asset. Opt for wider ranges in volatile pools to reduce the likelihood of being fully "ranged out," balancing IL risk against reduced fee concentration. Simulations suggest wider ranges can cut IL exposure by up to 30% in high-volatility scenarios.
Actively Monitor and Rebalance Positions
Passive liquidity provision often leads to losses (e.g., 49.5% of LPs in analyzed pools had negative returns). Use tools like DeFi dashboards or bots to track price movements and IL in real time. Rebalance positions by withdrawing and redepositing liquidity when prices shift significantly, though account for gas costs—data indicates rebalancing can boost returns by 15-20% in trending markets.
Leverage Fee Tiers Wisely
Uniswap v3 offers multiple fee tiers (e.g., 0.05%, 0.3%, 1%). Choose higher-fee tiers (e.g., 1%) for volatile pools to offset IL, as fees scale with trading volume. Studies show the 1% tier outperforms in high-volatility pairs, sometimes covering IL in active markets.
Avoid Overexposure During High Volatility
IL spikes during rapid price swings (e.g., ETH drops or pumps). Consider reducing liquidity provision during periods of expected turbulence (e.g., major economic announcements) and holding assets instead—research confirms HODLing beats LPing in 60% of volatile Uniswap v3 pools.
Explore Hedging Strategies
Mitigate IL by hedging with options, futures, or inverse perpetuals on centralized exchanges. For instance, shorting an asset in a pool can offset IL losses. While complex, this can turn a net loss into a break-even or profit scenario, especially for sophisticated LPs.
Conclusion
This study on understanding impermanent loss (IL) over time in Uniswap v3, using the USDC/ETH pool and Flipside Crypto data, reveals the dynamic and multifaceted nature of IL within v3’s concentrated liquidity framework. Unlike Uniswap v2’s uniform liquidity distribution, v3’s tick range system amplifies IL’s sensitivity to price movements, with IL escalating near and beyond range boundaries and spiking during sharp price swings regardless of direction. Market volatility emerges as a key multiplier, doubling or tripling IL within the range and causing exponential jumps when prices exit, while fee income, though boosted by v3’s design, often falls short of offsetting IL , succeeding only in low-volatility periods. Over time horizons, IL fluctuates rapidly daily ,accumulates with medium-term trends, and reflects cumulative volatility long-term, underscoring its non-static nature. For LPs, these findings highlight a critical trade-off: v3’s concentrated liquidity offers control and higher fees but exposes them to heightened IL risks, necessitating dynamic strategies like wider ranges during volatility or active position management. Ultimately, understanding IL over time in v3 equips LPs to navigate its risks and rewards, balancing range placement, market conditions, and fee potential to optimize returns in a decentralized finance landscape.
Data Source:
https://flipsidecrypto.xyz/studio/queries/2b03054d-f661-4bd6-af06-97e0b988ba8d
https://flipsidecrypto.xyz/studio/queries/4ffdc996-e681-421d-a8a2-3d0cbec5449f
https://flipsidecrypto.xyz/studio/queries/a1becb06-aeb0-48e1-ab8d-10afc26e980b
https://flipsidecrypto.xyz/studio/queries/43e7135d-b641-4b40-93bc-14eafeb5a188
References:
( Topaz Blue & Bancor Protocol. (2021, November 17). Impermanent loss in Uniswap V3. Topaz Blue. https://topaz.blue/uniswap-v3-report )
How to calculate impermanent loss:Here
Uniswap. (2021). Uniswap v3 Whitepaper: https://uniswap.org/whitepaper-v3.pdf
Flipside data Here